 Kivan Polimis
Social Media, Twitter API, and R
Kivan Polimis, Sun 17 April 2016, Tutorials
Kivan Polimis, Sun 17 April 2016, Tutorials
This post is a workshop that I created for a social media workshop during the 2016 Population Association of America Annual Meeting in Washington, D.C (April).
All relevant code will eventually be available on my github
We are going to learn various R functions for gathering, processing and analyzing Twitter API data. Our goal is to collect tweets by location and subject. This workshop is aimed at graduate students with some familiarity with R. The examples explored will gather tweets made in the Washington, D.C. area as well as tweets that mention presidential candidates Hillary Clinton and Donald Trump. If we have time, we will explore methods to map our results nationally and show where people are talking about the candidates.
Essential: R
Recommended:
RStudio
If you have never used R before, or if you feel that you need a refresher, we recommend that you go over this short R tutorial
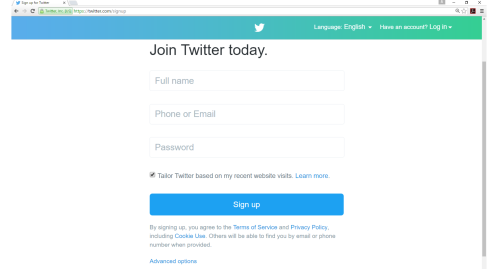
2. If you have a Twitter account, but it is not verified with a phone,
you would need to verify the account, by adding a mobile phone
number. Here is a link to the
instructions
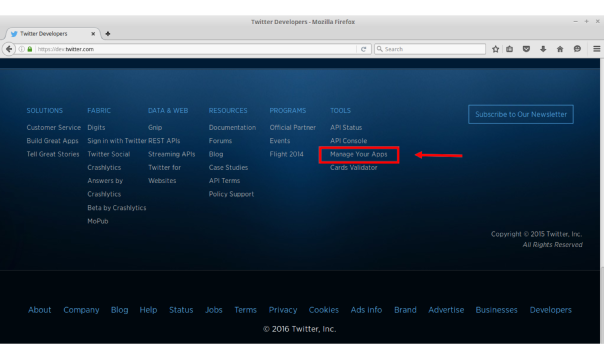
3. Create a new app Scroll to the bottom of the page and select Manage Your Apps under the Tools column (see highlighted box below)
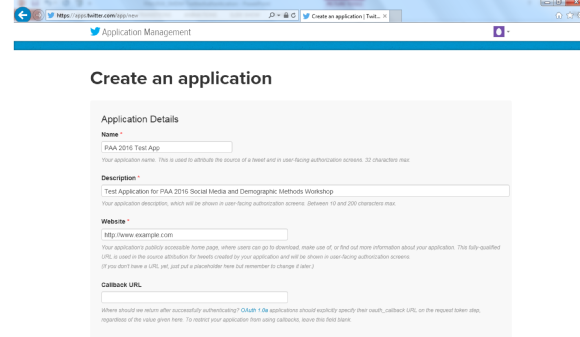
4. Obtain your consumer key, consumer secret, access token and access
token secret. You will insert these credentials below
You will need to have the following packages installed for the core of this workshop:
twitteRstreamRROAuthRCurldplyrBefore we can started, we need to clear our workspace, set a working directory, and load packages (you may need to install these packages the first time run this file). Fill in your working directory below by replacing "FILL ME IN" with the file path of your workshop folder
rm(list=ls())
setwd("FILL ME IN/PAA_2016_SMDM_Workshop/Twitter")
#' uncomment the command below to install the necessary packages
#install.packages(c("twitteR","streamR","ROAuth","dplyr","base64enc"))

#' Pablo Barbera, author of streamR, has written additional functions for Twitter analysis
#' uncomment the two commands below to download and add these functions to your environment with source
#download.file("https://raw.githubusercontent.com/pablobarbera/social-media-workshop/master/functions.r",
              "functions_by_pablobarbera.R")
#source("functions_by_pablobarbera.R")
source("twitterFunctions.R") # few functions to clean data
library(twitteR)
library(streamR)
library(ROAuth)
library(RCurl)
library(dplyr)
library(base64enc)
We will use two packages, streamR and twitteR, to retrieve tweets from the Twitter API. To access the functions in these packages, we will complete two authentication procedures.
streamRtwitteR#' Twitter credentials for streamR and twitteR authentication
consumer_key <- "FILL ME IN"
consumer_secret<- "FILL ME IN"
access_token<- "FILL ME IN"
access_token_secret<- "FILL ME IN"
#' parameters and URLs for streamR authentication
reqURL <- "https://api.twitter.com/oauth/request_token"
accessURL<- "https://api.twitter.com/oauth/access_token"
authURL<- "https://api.twitter.com/oauth/authorize"
#' Note: You only need to create an authentication object for streamR once
#' Microsoft Windows users need to uncomment the following command to download a cert file
#download.file(url="http://curl.haxx.se/ca/cacert.pem", destfile="cacert.pem")
#' create an object "cred" that will save the authenticated object for later sessions
twitCred<- OAuthFactory$new(consumerKey=consumer_key,consumerSecret=consumer_secret,
requestURL=reqURL,accessURL=accessURL,authURL=authURL)
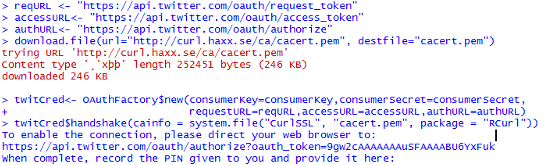
#' executing twitCred$handshake will redirect you to a website and provide your app a PIN
#' insert the PIN in the R console after you run this line
#' you can save authenticated credentials for later sessions
#' for later use, uncomment the following command in a folder that contains twitCred.RData
#load("twitCred.RData")
twitCred$handshake(cainfo = system.file("CurlSSL", "cacert.pem", package = "RCurl"))
save(twitCred, file = "twitCred.RData")
#' setup direct Twitter authentication for twitteR functions
#' you will be prompted to cache authentication token
#' you will need to repeat this step unless you are running analysis from a location with a
#' cached authentication token
setup_twitter_oauth(consumer_key, consumer_secret, access_token, access_token_secret)
Twitter authentication for streamR (Windows output with download.file executed shown)\
Search for tweets by location using twitteR package functions. The functions below interact with the trend portion of the Twitter API. Use Where on Earth Identifiers
(WOEID)
for locations
View column names and small subset of observations with glimpse command
availableTrendLocations()
woeid = availableTrendLocations()
glimpse(woeid)

#' get trending D.C. area tweets
DC_tweets = getTrends(2514815)
glimpse(DC_tweets)
#' trending hashtags
head(DC_tweets$name)
## [1] "Rockets"       "Dwight Howard" "Paul George"   "#MentorIRL"
## [5] "Raptors"       "#DCvTOR"
getCommonHashtags(DC_tweets$name)
## hashtags
##                #93KDay              #ADay2016        #brunchofidiots
##                      1                      1                      1
##         #CaratSelcaDay                  #CCCC  #CONGRATULATIONSHARRY
##                      1                      1                      1
##                #DCvTOR             #DevRelCon  #DreamvilleMusicVideo
##                      1                      1                      1
##    #IrritateMeIn4Words #ItsNoneOfYourBusiness              #LEMONADE
##                      1                      1                      1
##   #LetMeEntertainYouBy             #MentorIRL                 #NALCS
##                      1                      1                      1
##     #NashInMyrtleBeach              #NYRvsPIT        #RecordStoreDay
##                      1                      1                      1
##     #SignACastIn5Words               #SXonFOX
##                      1                      1
Search for tweets by subject using streamR package functions. The streamR functions interact with Twitter's Streaming API to filter tweets by keywords, users, language, and location
filterStreamparseTweetsfilterStream("ClintonTrump_tweets.json", track = c("Clinton", "Trump"),
locations = c(-125, 25, -66, 50), timeout = 60, oauth = twitCred)
#' parse .json file of tweets and convert parsed tweets to a data frame
ClintonTrump_tweets.df <- parseTweets("ClintonTrump_tweets.json", simplify = FALSE)
head(ClintonTrump_tweets.df)
#' print the amount of times Clinton and Trump are mentioned
Clinton_mentions <-length(grep("Clinton", ClintonTrump_tweets.df$text, ignore.case = TRUE))
Trump_mentions <-length(grep("Trump", ClintonTrump_tweets.df$text, ignore.case = TRUE))
sprintf("Clinton mentioned %d times in %d tweets", Clinton_mentions, nrow(ClintonTrump_tweets.df))
sprintf("Trump mentioned %d times in %d tweets", Trump_mentions, nrow(ClintonTrump_tweets.df))
## [1] "Clinton mentioned 397894 times in 5944511 tweets"

## [1] "Trump mentioned 1164798 times in 5944511 tweets"
use filterStream to search by location
map tweets with ggplot2 and grid packages
#' uncomment the following line the first time you run this file
#install.packages(c("ggplot2", "grid", "maps", "png", "lubridate"))
library(lubridate)
library(ggplot2)
library(grid)
library(maps)
library(png)
#' clean up tweets to include only english, alphanumeric tweets
#' subsets data frame of tweets to smallers subset of relevant variables
#' add tweet_timestamp column with lubridate package qualities
ClintonTrump_tweets.df <- clean_up_tweets(ClintonTrump_tweets.df)
ClintonTrump_tweets.df$tweet_timestamp <- sapply(ClintonTrump_tweets.df$created_at,tweet_time)
#' rearrange data by date
ClintonTrump_tweets.df<-arrange(ClintonTrump_tweets.df, tweet_timestamp)
#' find tweets start and end date
tweets_start<- strsplit(unlist(
ClintonTrump_tweets.df$tweet_timestamp)[1], split =' ')[[1]][1]
tweets_end<-strsplit(unlist(
ClintonTrump_tweets.df$tweet_timestamp[nrow(ClintonTrump_tweets.df)]), split =' ')[[1]][1]
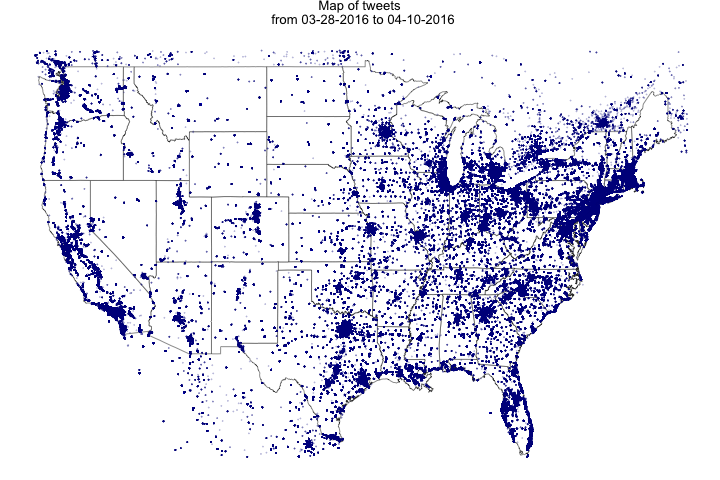
#' a small percentage of users have location access enabled for their tweets
#' increase the timeout number to gather more tweets and increase geo-tagged tweets
map.data <- map_data("state")
points <- data.frame(x = as.numeric(ClintonTrump_tweets.df$place_lon),
y = as.numeric(ClintonTrump_tweets.df$place_lat))
points <- subset(points, y > 25 & y <50)
points<-subset(points, x> -125 & x< -66)
tweets.map<-ggplot(map.data) + ggtitle(sprintf("Map of tweets \n from %s to %s",
tweets_start, tweets_end)) + geom_map(aes(map_id = region),
map = map.data, fill = "white", color = "grey20", size = 0.25) +
expand_limits(x = map.data$long, y = map.data$lat) + theme(axis.line = element_blank(),
axis.text = element_blank(), axis.ticks = element_blank(), axis.title = element_blank(),
panel.background = element_blank(), panel.border = element_blank(),
panel.grid.major = element_blank(), plot.background = element_blank(),
plot.margin = unit(0 * c(-1.5, -1.5, -1.5, -1.5), "lines")) +
geom_point(data = points, aes(x = x, y = y), size = .1, alpha = 1/5, color = "darkblue")
#' save map as a .png
png(filename="tweets-map.png", height = 480 , width = 720, units = "px")
plot(tweets.map)
dev.off()
#' alternative ways to save map
#plot(tweets.map)
#dev.print(png, 'tweets-map.png',height = 480 , width = 720, units = "px")
#dev.print(pdf, 'tweets-map.pdf')
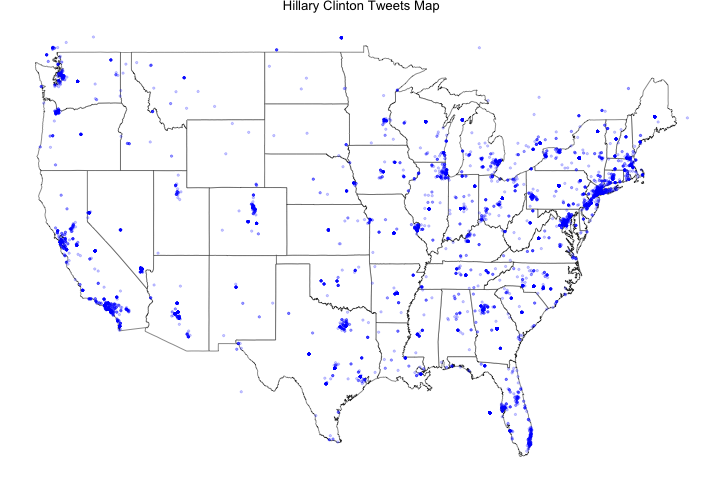
Map Clinton only tweets
#' Create a new data frame that only includes tweets that mentioned Clinton
Clinton_tweets <- ClintonTrump_tweets.df[grep("Clinton", ClintonTrump_tweets.df$text,
                                             ignore.case = TRUE), ]

Clinton_points <- data.frame(x = as.numeric(Clinton_tweets$place_lon),
                     y = as.numeric(Clinton_tweets$place_lat))

#' subset points to only include locations (roughly) within the United States
Clinton_points <- subset(Clinton_points, y > 25 & y <50)
Clinton_points<-subset(Clinton_points, x> -125 & x< -66)

Clinton_tweets.map<-ggplot(map.data) + ggtitle("Hillary Clinton Tweets Map") +
  geom_map(aes(map_id = region), map = map.data, fill = "white",
           color = "grey20", size = 0.25) + expand_limits(x = map.data$long, y = map.data$lat) +
  theme(axis.line = element_blank(), axis.text = element_blank(), axis.ticks = element_blank(),
        axis.title = element_blank(), panel.background = element_blank(), panel.border = element_blank(),
        panel.grid.major = element_blank(), plot.background = element_blank(),
        plot.margin = unit(0 * c(-1.5, -1.5, -1.5, -1.5), "lines")) +
  geom_point(data = Clinton_points, aes(x = x, y = y), size = .75, alpha = 1/5, color = "blue")

#' Save map of Clinton only tweets
png(filename="Clinton_tweets-map.png", height = 480 , width = 720, units = "px")
plot(Clinton_tweets.map)
dev.off()
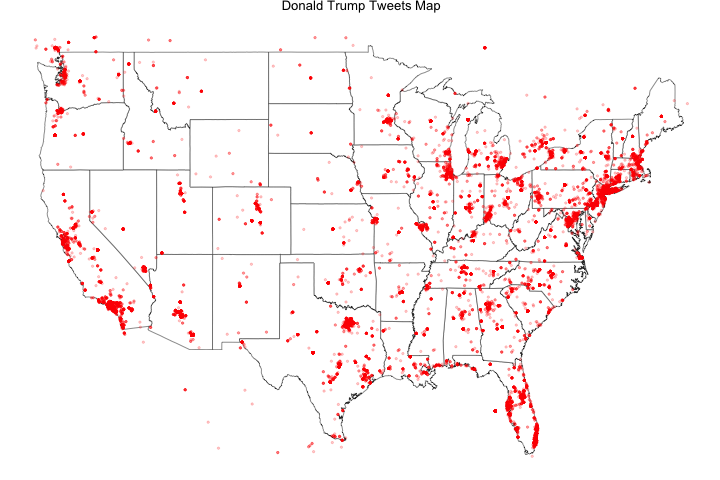
Map Trump only tweets
#' Create a new data frame that only includes tweets that mentioned Trump
Trump_tweets <- ClintonTrump_tweets.df[grep("Trump", ClintonTrump_tweets.df$text,
                                          ignore.case = TRUE), ]

Trump_points <- data.frame(x = as.numeric(Trump_tweets$place_lon),
                          y = as.numeric(Trump_tweets$place_lat))

#' subset points to only include locations (roughly) within the United States
Trump_points <- subset(Trump_points, y > 25 & y <50)
Trump_points<-subset(Trump_points, x> -125 & x< -66)

Trump_tweets.map<-ggplot(map.data) + ggtitle("Donald Trump Tweets Map") +
  geom_map(aes(map_id = region), map = map.data, fill = "white",
           color = "grey20", size = 0.25) + expand_limits(x = map.data$long, y = map.data$lat) +
  theme(axis.line = element_blank(), axis.text = element_blank(), axis.ticks = element_blank(),
        axis.title = element_blank(), panel.background = element_blank(), panel.border = element_blank(),
        panel.grid.major = element_blank(), plot.background = element_blank(),
        plot.margin = unit(0 * c(-1.5, -1.5, -1.5, -1.5), "lines")) +
  geom_point(data = Trump_points, aes(x = x, y = y), size = .75, alpha = 1/5, color = "red")

#' Save map of Trump only tweets
png(filename="Trump_tweets-map.png", height = 480 , width = 720, units = "px")
plot(Trump_tweets.map)
dev.off()
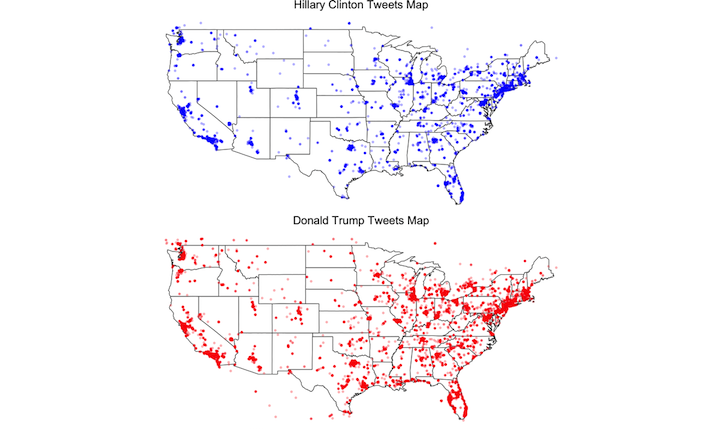
Compare Clinton and Trump tweet maps side-by-side
#' View Clinton and Trump maps side-by-side
grid.arrange(Clinton_tweets.map,Trump_tweets.map, ncol=2)
dev.off()

#' Save Clinton and Trump comparison map
require(gridExtra)
ggsave("combined_tweets-raw.png", arrangeGrob(Clinton_tweets.map,Trump_tweets.map), dpi = 300)

#' Improve comparison map image quality by rasterization
img <- readPNG("combined_tweets-raw.png")
grid.raster(img)
dev.off()

#' Save raster comparison map
png(filename="combined_tweets-map.png", height = 720 , width = 1200, units = "px")
grid.raster(img)
dev.off()
Save all objects in your current workspace and read back from file in the future
save.image(file = "PAA_2016_Twitter.RData")

#' future R sessions will require you to reload necessary libraries
#' uncomment the command below to load saved objects in future workspace sessions
#load("PAA_2016_Twitter.RData")
I would like to thank workshop collaborators (Nina Cesare, Charles Lanfear, Joan Ryan and Emilio Zagheni) for their questions and feedback while creating this module. Additionally, comments and suggestions from Michele Cadigan, Connor Gilroy, Jerald Herting, Bernease Herman and Valentina Staneva improved the presentation and workshop materials.