 Kivan Polimis
Positions Matter
Kivan Polimis, Mon 01 August 2016, Sports
Kivan Polimis, Mon 01 August 2016, Sports
collaborators: Long Chen, Melaku Dubie, Rich Lee and Kivan Polimis
Every year, hundreds of collegiate football players are invited to participate in a week-long scouting combine. Players are evaluated by NFL personnel departments on a series of physical and mental tests. Results from these “measurables” influence positioning in the NFL draft. Our goal with this project was to determine the association between pre-draft metrics and career performance. We Used Python to gather data from online sources (see Additional Information below) and create the plots. The plots show that for some positions, different combine metrics are more important predictors of career NFL performance.
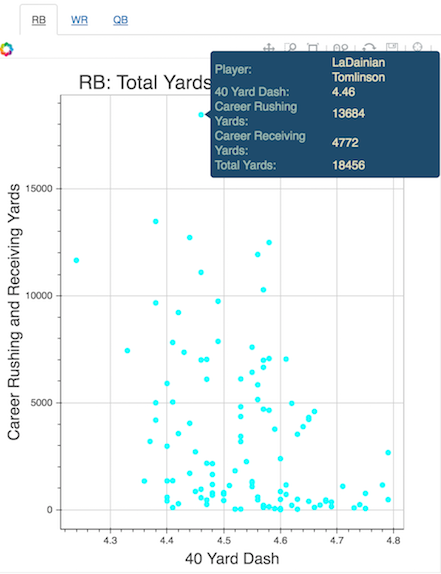
The example plot below describes the analysis and interactive plotting features.
![]()
Press the launch binder link above to open a jupyter notebook directory window. Select plots.ipynb to start an interactive notebook that plots the relationship between assorted Combine metrics (40 time, vertical, speed score, etc.) and total yards in a NFL career for quarterbacks, running backs and wide receivers.
Below each metric-specific plot is an explanation of the metric, the goal of the combine test, and a short discussion about variation between positions. LaDainian Tomlinson (highlighted player in example), is an elite running back that demonstrates a strong observed positional relationship between combine metrics and career performance:
There appears to be a slight negative relationship between 40 time and yardage for running backs indicating that faster running backs are more likely to have more productive careers. In contrast, there does not appear to be any clearly discernable relationship between yardage and 40 time for wide receivers or quarterbacks, suggesting that success for these positions may be more dependent on other characteristics such as skill, intelligence, or agility.
Hovering over an individual point on the plot reveals the following information: player name, result in the selected metric, and a combination of career rushing, receiving and passing yards depending on the player's position (selected by changing the tabs in the plot's upper left). Plots can also be zoomed in/out, saved, etc.
Passing, rushing and receiving data for individual seasons:
Pro-football reference
Scouting combine and player database:
NFL savant
For more information about this project, visit the NFL Combine Evaluation Repository for all relevant code. In this repository, we have the functions that gather and evaluate the relationship between pre-draft Combine metrics and career NFL performance.