NBA MVP Comparisons - Part 2
Part 2
In the previous post, Part
1 of the
NBA MVP Comparison series, we gathered the relevant NBA MVP finalist
data from
basketball-reference.com and
processed it.
Before going further, it is important to note that all analysis in Part
2 deals with MVP finalists from 1983 to the present (2018). This
decision was made to separate the pre-3 point era from the post-3 point
era which analytically and stylistically have different types of
players.
Our goal with this blog post is to understand which MVP finalist, but
non-MVP winner was most deserving of the award. To do this, we will
predict the continuous dependent variable, vote share (ranging from 0 to
1), of a MVP finalist with a vector (list) of the following predictors
(independent variables) from the processed MVP finalist data: age,
games_played, avg_minutes, avg_points, avg_rebounds, avg_assists,
avg_steals, avg_blocks, field_goal_pct, three_pt_pct,
free_throw_pct, win_shares, win_shares_per_48.
The specific questions that will allow us to assess which finalist was
most deserving of a MVP award are:
- Which MVP winner(s) outperformed their predicted vote share?
- Which MVP winner(s) should have finished second to another finalist
in predicted vote share?
In this post, we will:
- Compare machine learning (ML) models for selecting the MVP award
- Identify the finalists deserving of a MVP award
While the language of statistical models deals more with over- and
under-performance, I will interchange these terms with more colloquial
language such as robbed/robbery.
Outline
- Compare Machine Learning Regression Models
- Determine Controversial MVPs
- Choose New MVPs
Models Overview
- Which model did well?
- To predict MVP awards and vote share, I used machine learning (ML)
regression models
- Machine learning
refers to algorithms and models that perform predictions with
advanced pattern recognition/correlations and are devoid of explicit
human programming
- ML models were compared with the metric Root Mean Square Error
(RMSE)
ML Regression Models
- Random Forest
Regressor
- Ensemble learning method that constructs decision trees and
creates a mean prediction of the individual trees
- Latent Discriminant
Analysis
- Uses a linear combination of features to separate two or more
classes
- Gradient Boost
- Uses "weak learners", predicts loosely correlated with outcome
variable, in an ensemble method to produced boosted "strong
learners" with optimization
- XGBoost
- Gradient boosting method "robust enough to support fine tuning
and addition of regularization parameters"
Compare ML Regression Models
- To prepare the data for the ML models:
- I split the MVP data into training (80%) and test datasets (20%)
- The models are trained (learn the patterns) on the training set
and then compared on how well they predict the MVPs in the test
set
- Why Root Mean Square Error
(RMSE)?
$$ RMSE = \sqrt{\frac{1}{n}\sum_{i=1}^{n}(Actual_{i} - Predicted_{i})^2} $$
- RMSE is the square root of the average of squared differences
between predicted values and actual observation. The RMSE ranges
from 0 to ∞ and the direction (positive/negative) of the residual
(Prediction - Actual) is inconsequential because the residual is
squared. Lower RMSE correspond with better performing models.
- RMSE equation as a function in R:
RMSE = function(actual, predicted) {
  RMSE = sqrt(sum(mean(actual-predicted)^2))
  return(RMSE)
  }
RMSE Table
| Latent Discriminant Analysis |
0.002 |
| XGBoost - Linear |
0.004 |
| Random Forest Classifier |
0.005 |
| Gradient Boost |
0.011 |
| XGBoost - Tree |
0.012 |
- The Latent Discriminant Analysis (LDA) was the best performing
model
- Henceforth, "the model" will refer to the LDA model
Latent Discriminant Analysis (LDA)
Because our predicted variable, vote share, is continuous we need a rule
to predict the binary (winner/loser(s)) MVP award. The rule we will use
is the player with the maximum predicted vote share (LDA Prediction) for
a given year will be awarded the MVP. This rule will need additional
complexity to handle potential ties. The order of tiebreakers for
playoff seeding is near the bottom of this
article.
Perhaps we could adopt similar rules for vote share ties; fortunately
for this analysis, there were no ties.
- Use
dplyr library and ifelse function within mutate
- Create the binary LDA MVP variable based on our rule
mvp_finalist_data = mvp_finalist_data %>%
  group_by(Year) %>%
  mutate(`LDA MVP` = ifelse(`LDA Prediction` == max(`LDA Prediction`), 1,
                     ifelse(`LDA Prediction` != max(`LDA Prediction`), 0,0)))
- What did the LDA model do well?
- 30 of 36 MVPs accurately predicted with LDA vote share model
- How do we find where the model "struggled"?
- LDA unsuccessfully predicts MVP
- LDA predicts another player that year with higher vote share as
a better candidate for the MVP
LDA Correct MVP Predictions
| Moses Malone |
27 |
1983 |
PHI |
1 |
0.96 |
1 |
1 |
| Larry Bird |
28 |
1985 |
BOS |
1 |
0.978 |
1 |
1 |
| Larry Bird |
29 |
1986 |
BOS |
1 |
0.981 |
1 |
1 |
| Magic Johnson |
27 |
1987 |
LAL |
1 |
0.94 |
1 |
1 |
| Michael Jordan |
24 |
1988 |
CHI |
1 |
0.831 |
1 |
1 |
| Magic Johnson |
29 |
1989 |
LAL |
1 |
0.782 |
1 |
1 |
| Michael Jordan |
27 |
1991 |
CHI |
1 |
0.928 |
1 |
1 |
| Michael Jordan |
28 |
1992 |
CHI |
1 |
0.938 |
1 |
1 |
| Charles Barkley |
29 |
1993 |
PHO |
1 |
0.852 |
1 |
1 |
| Hakeem Olajuwon |
31 |
1994 |
HOU |
1 |
0.88 |
1 |
1 |
| David Robinson |
29 |
1995 |
SAS |
1 |
0.858 |
1 |
1 |
| Michael Jordan |
32 |
1996 |
CHI |
1 |
0.986 |
1 |
1 |
| Michael Jordan |
34 |
1998 |
CHI |
1 |
0.934 |
1 |
1 |
| Shaquille O'Neal |
27 |
2000 |
LAL |
1 |
0.998 |
1 |
1 |
| Allen Iverson |
25 |
2001 |
PHI |
1 |
0.904 |
1 |
1 |
| Tim Duncan |
25 |
2002 |
SAS |
1 |
0.757 |
1 |
1 |
| Tim Duncan |
26 |
2003 |
SAS |
1 |
0.808 |
1 |
1 |
| Kevin Garnett |
27 |
2004 |
MIN |
1 |
0.991 |
1 |
1 |
| Dirk Nowitzki |
28 |
2007 |
DAL |
1 |
0.882 |
1 |
1 |
| Kobe Bryant |
29 |
2008 |
LAL |
1 |
0.873 |
1 |
1 |
| LeBron James |
24 |
2009 |
CLE |
1 |
0.969 |
1 |
1 |
| LeBron James |
25 |
2010 |
CLE |
1 |
0.98 |
1 |
1 |
| Derrick Rose |
22 |
2011 |
CHI |
1 |
0.977 |
1 |
1 |
| LeBron James |
27 |
2012 |
MIA |
1 |
0.888 |
1 |
1 |
| LeBron James |
28 |
2013 |
MIA |
1 |
0.998 |
1 |
1 |
| Kevin Durant |
25 |
2014 |
OKC |
1 |
0.986 |
1 |
1 |
| Stephen Curry |
26 |
2015 |
GSW |
1 |
0.922 |
1 |
1 |
| Stephen Curry |
27 |
2016 |
GSW |
1 |
1 |
1 |
1 |
| Russell Westbrook |
28 |
2017 |
OKC |
1 |
0.879 |
1 |
1 |
| James Harden |
28 |
2018 |
HOU |
1 |
0.955 |
1 |
1 |
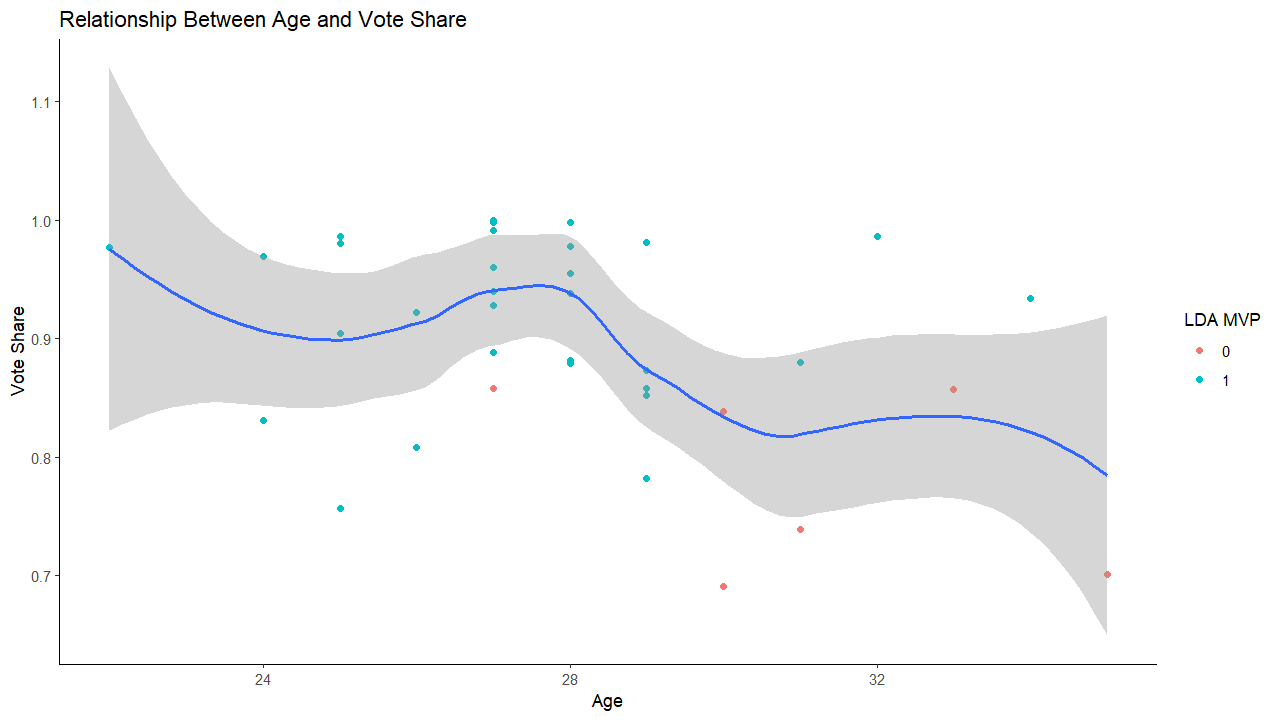
- Green dots represent MVP winners successfully predicted by the model
- Red dots represent MVP winners the model missed
- MVP winners are clustered between ages 27 and 29
- Older winners average lower vote share
- The model struggled with predicting older MVP winners
Controversial MVPs
- Which MVP winner(s) outperformed their predicted vote share?
- Which MVP winner(s) should have finished second to another finalist
in predicted vote share?
Identify controversial MVPs
Identify controversial MVPs
- Select MVPs that the LDA model missed
- Create additional column for residual or error
- Absolute value of the difference between actual and predicted
vote share for a MVP finalist
- Residuals help us determine how much a player over- or
under-performed relative to our model
mvp_finalist_data = mvp_finalist_data %>%
  mutate(Residual = abs(`Vote Share`-`LDA Prediction`))
Controversial MVPs
| Larry Bird |
27 |
1984 |
BOS |
0.858 |
0.347 |
0.511 |
0 |
| Magic Johnson |
30 |
1990 |
LAL |
0.691 |
0.518 |
0.173 |
0 |
| Karl Malone |
33 |
1997 |
UTA |
0.857 |
0.857 |
0 |
0 |
| Karl Malone |
35 |
1999 |
UTA |
0.701 |
0.701 |
0 |
0 |
| Steve Nash |
30 |
2005 |
PHO |
0.839 |
0.739 |
0.1 |
0 |
| Steve Nash |
31 |
2006 |
PHO |
0.739 |
0.739 |
0 |
0 |
- Steve Nash (2005, 2006) and Karl Malone (1997, 1999) are repeat
offenders!
- A quick note on Larry in 1984 and Magic in 1990:
- Larry had the highest residual (0.511), overperformance, of any
MVP winner
- Magic Johnson owns the second highest winner residual of 0.173.
- Can't tell a story of basketball without tying Larry and Magic
together.
- The controversial MVP discussion will focus on Malone and Nash
- Whom did the models prefer in 1984, 1990, 1997, 1999, 2005, and
2006?
LDA Preferred MVPs
| Bernard King |
27 |
1984 |
NYK |
2 |
0.491 |
0.491 |
0 |
1 |
| Charles Barkley |
26 |
1990 |
PHI |
2 |
0.667 |
0.667 |
0 |
1 |
| Michael Jordan |
33 |
1997 |
CHI |
2 |
0.832 |
0.934 |
0.102 |
1 |
| Shaquille O'Neal |
26 |
1999 |
LAL |
6 |
0.075 |
0.888 |
0.813 |
1 |
| Shaquille O'Neal |
32 |
2005 |
MIA |
2 |
0.813 |
0.813 |
0 |
1 |
| Chauncey Billups |
29 |
2006 |
DET |
5 |
0.344 |
0.977 |
0.633 |
1 |
- The model preferred 2nd place finishers in 4 of 6
controversial MVP years
- 1984 projects as the only year a potential MVP (Bernard King) would
not have a vote share majority
The Robbers
- Although Karl Malone and Steve Nash both "stole" 2 MVPs, I'm going
to focus on Steve Nash
- Steve Nash draws more scrutiny because Malone's predicted vote share
in our model doesn't change
- Our model predicts that two players were overlooked in his
winning years
- One such overlooked player was Michael Jordan in 1997
- Jordan would go on to win the 1998 MVP award
- If Jordan had won the 1997 award, his legacy could have spanned
seven MVPs
- Maybe voter fatigue was a factor in denying Jordan his
6th MVP (at that time) for Malone's first
- Contrastingly, our model shows that Steve Nash overperformed in one
year
- Nash also should have faced a finalist with better vote share en
route to his second MVP
- Our model suggests that Steve Nash overperformed in 2005 by 0.1
where Malone never overperformed
The Robbed
- Shaq and Chauncey Billups wildly underperformed in 2 years the model
had them as clear favorites
- Shaq has the most beef as the only player robbed of two potential
MVPs
- Shaq recorded the highest residual prediction value (0.813)
- Shaq was the most underrated MVP finalist ever in his 1999
campaign
- Shaq also loses a MVP in 2005 when our model suggests that Steve
Nash overperformed
- Chauncey in 2006 had the second highest residual of 0.633 and could
be the rightful owner of Steve Nash's second MVP
Review
- We compared multiple machine learning regression models to determine
MVP/MVP vote share
- Concluded that Steve Nash and Karl Malone repeatedly robbed
deserving MVP candidates
- Predicted that Larry Bird had the most over-inflated vote share of
any MVP winner
- Voters may have corrected for failing to give MVP awards to Jordan
and Shaq in 1997 and 1999, respectively, by rewarding the players
with the MVP in the subsequent year
Download a .pdf of this post
 Kivan Polimis