---
title: "Triple Double Russ, Revisited"
date: "2026-08-12"
author: "Kivan Polimis"
description: "Four seasons after the original post, I re-scrape Russell Westbrook's full game log and re-test the thesis: do his teams really win more when he records a triple double? With 345 more team games and a late-career move to the bench, the answer holds, but it now says less about present-day Westbrook than it did in 2022."
categories: [sports-analytics, python]
draft: false
jupyter: blog
execute:
cache: false
---
In March 2022 I wrote [Triple Double Russ](../triple-double-russ/), which scraped
Russell Westbrook's game log and asked a simple question: when he records a triple
double, do his teams win more often? The answer then was yes, and by a wide,
statistically significant margin. That post was a snapshot of a career still in
motion. Westbrook has since played four more seasons and changed teams three times,
moving from a featured star to a reserve. This revisit re-collects the data through
the 2025-26 season and asks two things: is the same analysis still reproducible, and
does the original thesis still hold?
I am keeping the [original post](../triple-double-russ/) unchanged as a 2022 time
capsule. Everything below is recomputed from a fresh scrape.
## Is data collection still possible?
Yes, with one repair. Basketball-Reference still publishes Westbrook's per-season game
logs at the same URLs the original post used, for instance
[the 2025-26 log](https://www.basketball-reference.com/players/w/westbru01/gamelog/2026),
and a plain request still returns them. What changed is the markup. The 2022 scraper
keyed on the old game-log table and its column layout; the site has since renamed the
table to `player_game_log_reg` and moved every statistic behind a `data-stat`
attribute (`pts`, `trb`, `ast`, `game_result`). A scraper written against the 2022
page returns an empty table today rather than an error, which is the quiet kind of
failure worth guarding against. The rewritten scraper lives in
[`fetch_westbrook_data.py`](fetch_westbrook_data.py) and raises loudly if the expected
table is missing.
Two practical notes carried over from the original. Basketball-Reference rate-limits
scrapers, so the fetch script sleeps between requests. And to keep this page building
without touching the network, the scrape is cached to a CSV that the analysis below
reads. The numbers here are current as of the 2025-26 season; re-running the fetch
script later will collect more games.
```{python}
#| label: setup
#| include: false
import numpy as np
import pandas as pd
import seaborn as sns
import matplotlib.pyplot as plt
from scipy.stats import norm
# ── Load cached game logs ─────────────────────────────────────────────────────
games = pd.read_csv("data/westbrook_game_logs.csv")
# Schema guard: catch a Basketball-Reference layout change (or a stale scrape)
# before it silently corrupts every downstream number.
_REQUIRED = {"date", "season_start", "season_end", "location", "active",
"result_b", "margin", "points", "total_rebs", "assists",
"steals", "blocks"}
_missing = _REQUIRED - set(games.columns)
if _missing:
raise ValueError(f"westbrook_game_logs.csv missing columns: {_missing}. "
"Re-run fetch_westbrook_data.py.")
del _missing
# ── Triple-double indicator (same 7-scenario definition as the 2022 post) ─────
def triple_double(row):
"""Return 1 if any three of pts/reb/ast/stl/blk reach double digits."""
p, t, a = row["points"], row["total_rebs"], row["assists"]
s, b = row["steals"], row["blocks"]
trios = [(p, t, a), (p, t, b), (p, t, s), (p, a, s),
(p, a, b), (t, a, b), (t, a, s)]
return int(any(x >= 10 and y >= 10 and z >= 10 for x, y, z in trios))
games["triple_double"] = games.apply(triple_double, axis=1)
games.loc[games["active"] == 0, "triple_double"] = 0 # missed games are not TDs
# ── Slices ────────────────────────────────────────────────────────────────────
active = games[games["active"] == 1]
td = active[active["triple_double"] == 1]
non_td = active[active["triple_double"] == 0]
# ── Headline counts ───────────────────────────────────────────────────────────
career_games = len(games)
active_games = len(active)
active_pct = 100 * active_games / career_games
td_games = len(td)
non_td_games = len(non_td)
td_rate = 100 * td_games / active_games
# ── Win percentages ───────────────────────────────────────────────────────────
career_win = 100 * games["result_b"].mean()
active_win = 100 * active["result_b"].mean()
td_win = 100 * td["result_b"].mean()
non_td_win = 100 * non_td["result_b"].mean()
win_gap = td_win - non_td_win
# ── Two-proportion z-test: TD vs non-TD win rate ──────────────────────────────
w_td, n_td = td["result_b"].sum(), len(td)
w_nt, n_nt = non_td["result_b"].sum(), len(non_td)
p_pool = (w_td + w_nt) / (n_td + n_nt)
se = np.sqrt(p_pool * (1 - p_pool) * (1 / n_td + 1 / n_nt))
z_stat = (w_td / n_td - w_nt / n_nt) / se
p_value = 2 * (1 - norm.cdf(abs(z_stat)))
# ── Margins ───────────────────────────────────────────────────────────────────
td_win_margin = td[td["result_b"] == 1]["margin"].mean()
td_loss_margin = td[td["result_b"] == 0]["margin"].mean()
non_td_win_margin = non_td[non_td["result_b"] == 1]["margin"].mean()
non_td_loss_margin = non_td[non_td["result_b"] == 0]["margin"].mean()
# ── Kevin Durant split (Durant left OKC after the 2015-16 season) ─────────────
td_with_kd = len(td[td["season_start"] < 2016])
td_without_kd = len(td[td["season_start"] >= 2016])
# ── Seasonal / location tables for charts ─────────────────────────────────────
season_range = range(games["season_end"].min(), games["season_end"].max() + 1)
td_by_season = (td.groupby("season_end").size()
.reindex(season_range, fill_value=0))
td_by_loc = (td.groupby(["season_end", "location"]).size()
.unstack("location", fill_value=0)
.reindex(season_range, fill_value=0))
```
## What the updated data looks like
The fresh scrape covers every regular-season team game from Westbrook's 2008-09 rookie
year through 2025-26. The original post had 1,093 team games to work with; this one has
`{python} f"{career_games:,}"`.
```{python}
#| label: totals
print(f"Career team games: {career_games}")
print(f"Active for {active_games} of them ({active_pct:.2f}%)")
print(f"Triple doubles: {td_games} ({td_rate:.2f}% of active games)")
print(f"Active games without a triple double: {non_td_games}")
```
The triple-double count is the load-bearing number, so it is worth checking against an
authority. Basketball-Reference's
[career triple-double leaderboard](https://www.basketball-reference.com/leaders/trp_dbl_career.html)
lists Westbrook first all-time with 209 as of the 2025-26 season. The scrape-and-count
here returns `{python} f"{td_games}"`, an exact match. The definition is unchanged from
2022: a triple double is any game where three of points, rebounds, assists, steals, or
blocks reach double digits, which in practice is almost always points, rebounds, and
assists.
## Does the thesis still hold?
The 2022 post found that Westbrook's teams won 73.58% of games in which he recorded a
triple double, against 55.79% when he did not. The updated numbers:
```{python}
#| label: win-pct-table
pd.DataFrame(
    {"Win %": [f"{career_win:.2f}%", f"{active_win:.2f}%",
               f"{td_win:.2f}%", f"{non_td_win:.2f}%"]},
    index=["Career", "Active", "With a triple double", "Without a triple double"],
)
```
The thesis holds. Westbrook's teams still win about
`{python} f"{td_win:.0f}"`% of the games in which he records a triple double, a figure
that has barely moved in four seasons, and only `{python} f"{non_td_win:.0f}"`% of the
games in which he does not. If anything the gap has widened slightly, from roughly 18
points in 2022 to `{python} f"{win_gap:.1f}"` points now, because his non-triple-double
win rate has drifted down as his teams have gotten worse. A two-proportion z-test
rejects the null that the two win rates are equal.
```{python}
#| label: ztest
print(f"z = {z_stat:.3f}, p = {p_value:.2e}")
```
That the relationship survived four more seasons and three team changes is the strong
form of the result. It is also where caution belongs. A triple double is not a treatment
applied at random. It marks a game in which Westbrook played heavy minutes and stayed
involved on both ends, and those games cluster in the seasons where he was a featured
starter on a competitive team, for instance his 2016-17 MVP campaign in Oklahoma City
and his 2020-21 season in Washington. The win-percentage gap is real, but it is a
statement about the kind of game a triple double signals, not evidence that chasing the
tenth assist causes the win.
The late-career data makes that caveat concrete rather than theoretical.
## The role change the original post could not see
Since 2023, Westbrook has been a reserve, moving from the Clippers to the Nuggets to the
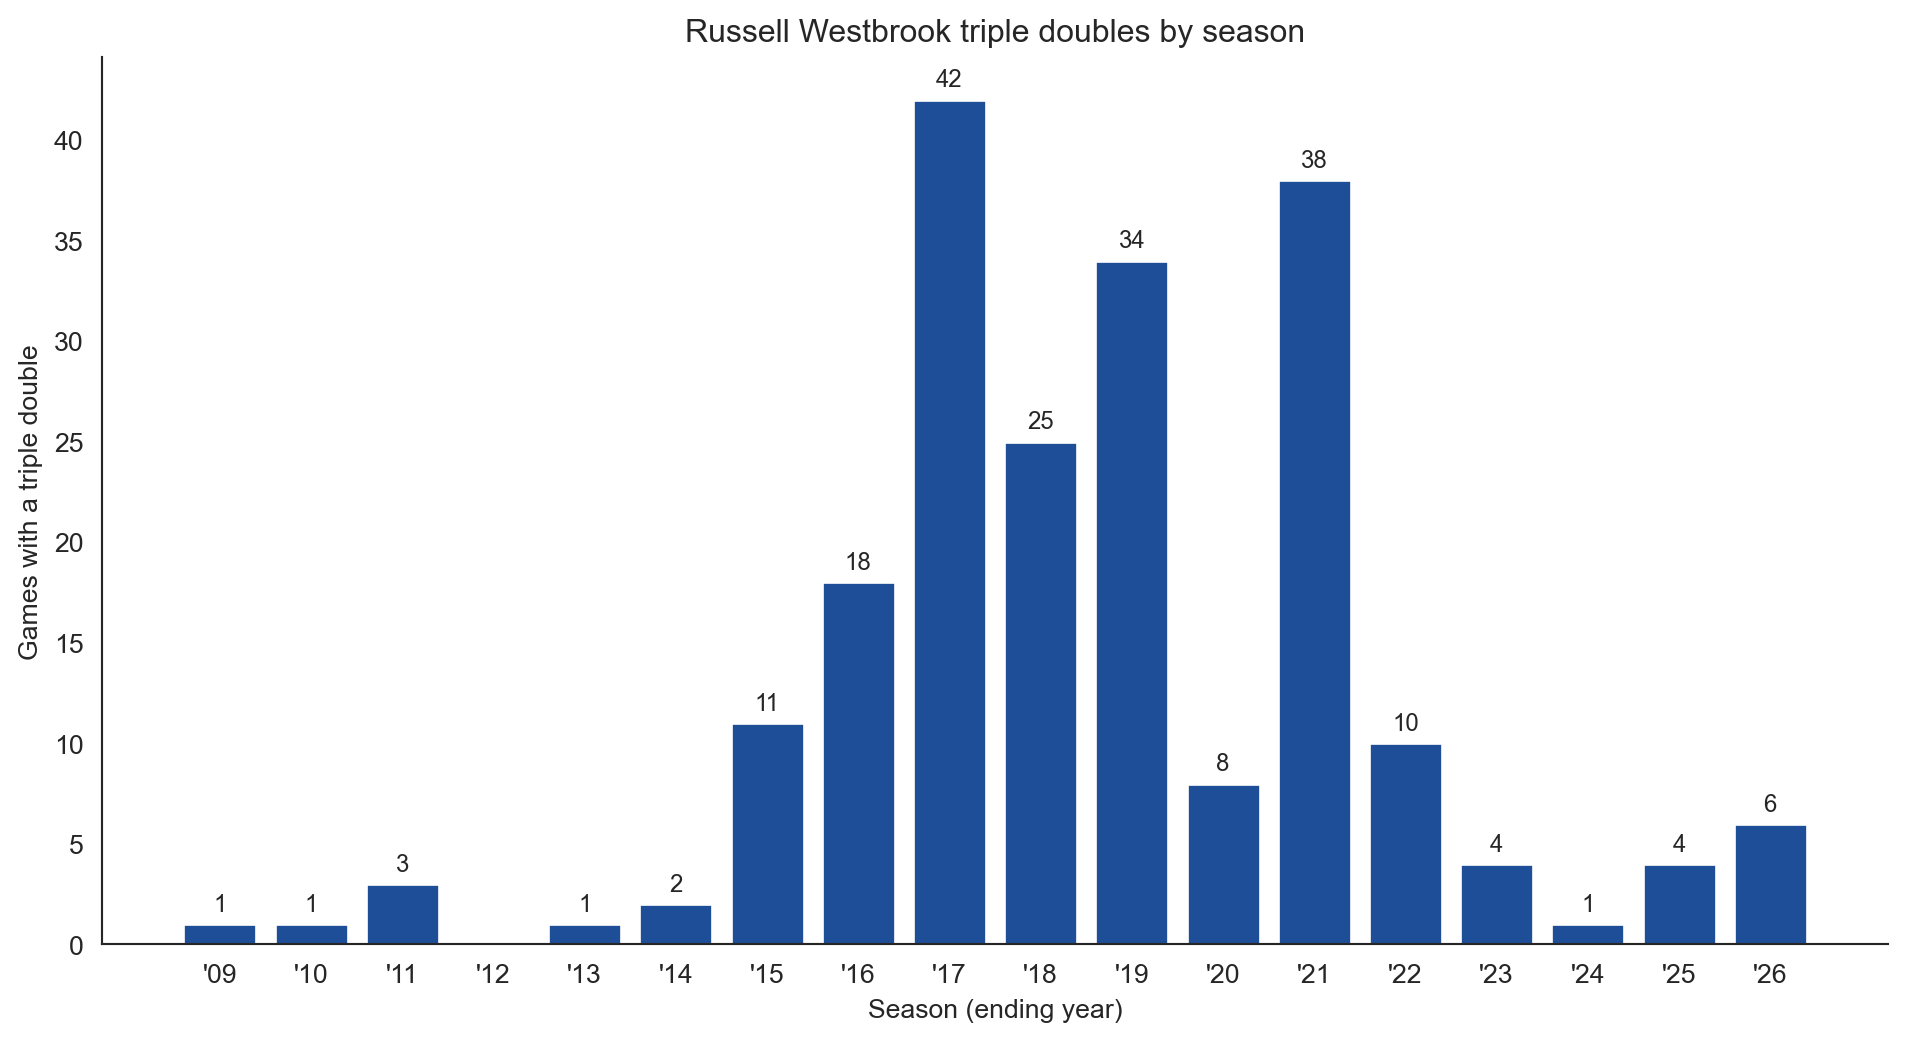
Kings and coming off the bench for most of those games. His triple-double rate collapsed
accordingly. The seasonal counts tell the story better than any summary statistic.
```{python}
#| label: fig-seasonal
#| fig-cap: "Triple doubles by season, from Westbrook's 2008-09 rookie year through 2025-26. The peak seasons are his post-Durant years in Oklahoma City, Houston, and Washington; the collapse after 2022 tracks his move to a bench role."
sns.set_style("white")
fig, ax = plt.subplots(figsize=(12, 6))
labels = [f"'{str(y)[2:]}" for y in td_by_season.index]
bars = ax.bar(labels, td_by_season.values, color="#1f4e99")
ax.set(xlabel="Season (ending year)",
       ylabel="Games with a triple double",
       title="Russell Westbrook triple doubles by season")
for bar, val in zip(bars, td_by_season.values):
    if val:
        ax.text(bar.get_x() + bar.get_width() / 2, val + 0.4, str(val),
                ha="center", va="bottom", fontsize=9)
sns.despine()
plt.show()
```
The four seasons added since the original post contributed
`{python} f"{int(td_by_season.loc[2023:2026].sum())}"` triple doubles combined, fewer
than he recorded in the single 2016-17 season. The thesis, then, is now carried almost
entirely by his prime. It describes 2017-era Westbrook accurately and 2026-era
Westbrook barely, because the reserve version of him rarely plays the kind of game that
produces a triple double in the first place. This is the generalizability caution in
practice. A relationship estimated over a career can hold in aggregate while saying
little about the player as he exists today.
## Home, away, and the Durant question
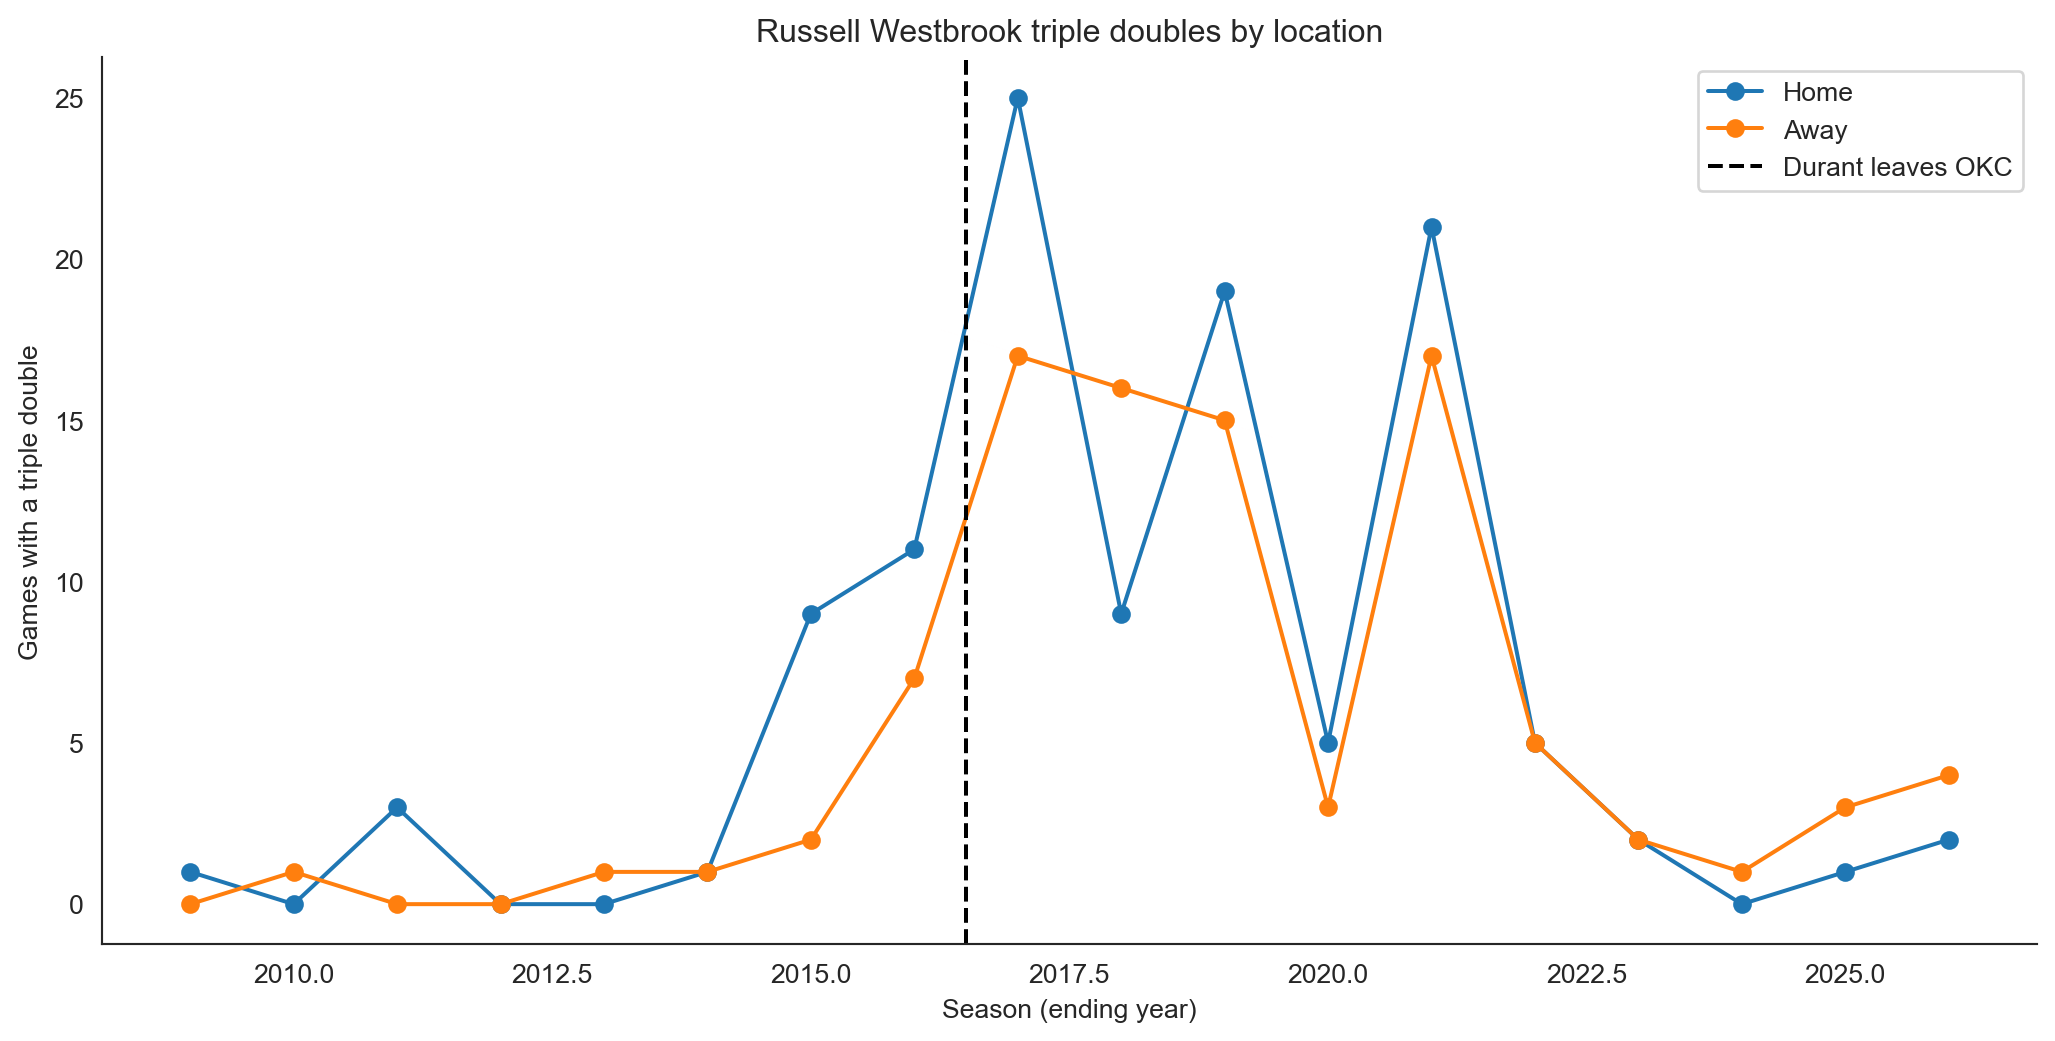
The original post split triple doubles by location and marked Durant's 2016 departure
from Oklahoma City, on the theory that Westbrook's triple-double era began once he was
the unambiguous focal point of the offense.
```{python}
#| label: fig-location
#| fig-cap: "Triple doubles by season, split by home and away. The dashed line marks Kevin Durant's 2016 departure from Oklahoma City, after which Westbrook's triple-double production jumped."
fig, ax = plt.subplots(figsize=(13, 6))
years = list(td_by_loc.index)
ax.plot(years, td_by_loc.get("Home", 0), marker="o", label="Home")
ax.plot(years, td_by_loc.get("Away", 0), marker="o", label="Away")
ax.axvline(x=2016.5, color="k", linestyle="--")
ax.set(xlabel="Season (ending year)",
       ylabel="Games with a triple double",
       title="Russell Westbrook triple doubles by location")
ax.legend(["Home", "Away", "Durant leaves OKC"], loc="upper right")
sns.despine()
plt.show()
```
The split by era is stark:
```{python}
#| label: kd-split
print(f"With Durant (through 2015-16):   {td_with_kd} triple doubles")
print(f"After Durant (2016-17 onward):   {td_without_kd} triple doubles")
```
Westbrook recorded `{python} f"{td_with_kd}"` triple doubles across his eight seasons
sharing a team with Durant and `{python} f"{td_without_kd}"` in the seasons after. Some
of that is simply age and tenure, an older Westbrook with the ball in his hands more
often, so I would not read the Durant departure as the sole cause. But the timing is
hard to ignore, and it lines up with the win-percentage story: the triple-double
seasons are the seasons in which Westbrook was the engine of his team.
## Margins: still no sign of selfish stat-chasing
The sharpest criticism of Westbrook is that he chases triple doubles at his team's
expense. If that were true, we would expect his teams to lose by more in games where he
gets a triple double, the empty-stat-line loss. The margins say the opposite.
```{python}
#| label: margins
pd.DataFrame(
    {"Avg. margin": [f"{td_win_margin:+.2f}", f"{non_td_win_margin:+.2f}",
                     f"{td_loss_margin:+.2f}", f"{non_td_loss_margin:+.2f}"]},
    index=["Triple-double wins", "Non-triple-double wins",
           "Triple-double losses", "Non-triple-double losses"],
)
```
When Westbrook's teams win, the margin is nearly identical whether or not he records a
triple double (`{python} f"{td_win_margin:.1f}"` against
`{python} f"{non_td_win_margin:.1f}"`). When they lose, they lose by
*less* with a triple double (`{python} f"{td_loss_margin:.1f}"`) than without
(`{python} f"{non_td_loss_margin:.1f}"`). That is the same conclusion the 2022 post
reached, and four more seasons did not disturb it. Whatever a Westbrook triple double
is, it is not a marker of a team quietly losing while he pads his line.
## Review
The 2022 result survives replication. Westbrook's teams win far more with a triple
double (`{python} f"{td_win:.0f}"`%) than without (`{python} f"{non_td_win:.0f}"`%), the
difference is statistically significant, and the margin data shows no evidence that his
triple doubles come at his team's expense. The scrape is still possible, once the table
name is repaired, and the count still matches Basketball-Reference to the game.
What the extra four seasons add is a caveat the original post had no way to see. The
relationship is anchored in Westbrook's prime, and his move to the bench has made triple
doubles rare enough that the thesis now describes a version of him that no longer takes
the floor most nights. The statistic is durable. The player it was measuring has moved
on. Both things can be true, and holding them together is the honest reading of the
updated data.
## Footnotes
```{python}
#| label: versions
import sys
import IPython
import matplotlib as mpl

print("originally published 2022-03-06; revisited 2026-08-12")
print(f"Python:     {sys.version.split()[0]}")
print(f"pandas:     {pd.__version__}")
print(f"numpy:      {np.__version__}")
print(f"seaborn:    {sns.__version__}")
print(f"matplotlib: {mpl.__version__}")
print(f"IPython:    {IPython.__version__}")
```
The scraping code is in [`fetch_westbrook_data.py`](fetch_westbrook_data.py), and the
cached dataset it produces is
[`data/westbrook_game_logs.csv`](data/westbrook_game_logs.csv). The
[original 2022 post](../triple-double-russ/) is preserved as-is.