Code
from utils import *
import constants as c In this post, we use webscraping to analyze Russell Westbrook’s (Russ) team performance when he records a triple double. We will use multiple Python modules and focus on BeautifulSoup, pandas, matplotlib, and seaborn
Russell Westbrook is a lightning rod for discussion in the NBA because of his style of play and clashes with popular players like his beef with former teammate Kevin Durant. Westbrook’s high energy, domineering style of play is best characterized by the the statistic he is known for, the triple double.
Traditional NBA box scores collect statistics on 5 individual player categories: points, rebounds, assists, steals, and blocks1. When a player has 10 or more instances of each category (“double”) in 3 categories (“triple), the collective statisitcal feat is known as a triple double. Westbrook is the NBA leader in career triple doubles and recently broke Hall of Famer Oscar Robertson’s 47 year-old record in the 2020-21 season. Robertson was the original”Mr. Triple Double” and some have used the moniker with Russ.
While there are many supporters of Westbrook in print and video, including videos praising Russ for his ability to create triple doubles, there is also considerable pushback of Russ’ pursuit of a triple double. Check the plays compiled in this video for instance. At the time of the compiled plays, Westbrook is 2 assists shy of a triple double and declines to take several open shots in order to pass the ball to a teammate in the hopes of getting an assist. Several plays are awkward with Westbrook putting teammates in bad positions and some plays ending in turnovers. For me, the most egregious example of a player selfishly pursuing a triple double is Ricky Davis in 2003. With seconds remaining in the game his team was winning by 25, Davis attempted a shot on his team’s basket in order to secure what he hoped would be his 10th rebound and a triple double (Davis was not credited with the rebound or triple double). That Westbrook video is nothing near the cynicism of Davis, but the discussion prompted by Russ’ triple double ability is: “Do Westbrook’s teams win more games when he creates a triple double?”
In order to investigate Russ’ team performance when he creates a triple double we need to gather his individual statistics and team performance during his games. We can gather both sources of information from Basketball-Reference.com and create a function to tabulate triple doubles. Then we will compare the win percentage of Westbrook’s teams when he does and does not have a triple double to assess if his pursuit of a triple doubles negatively impacts team performance. We will subset our analysis to only Westbrook’s Regular Season games
In [1]:
from utils import *
import constants as c Russell Westbrook’s player data is available at the following link: https://www.basketball-reference.com/players/w/westbru01.html. We can use the webbrowser module to open this url with the code below
In [2]:
westbrook_basketball_reference_url = "https://www.basketball-reference.com/players/w/westbru01.html"
webbrowser.open(westbrook_basketball_reference_url)TrueIn order to create a dataset that includes Westbrook’s individual and team performance, we need to scrape his yearly game log data. An example yearly game log is, https://www.basketball-reference.com/players/w/westbru01/gamelog/2022, the game log for this current season. To accomplish this task, we need to * Find out how many years of game log data is available * Create an empty list that will contain all yearly game log dataframes * Create a list to store any errors that may come up while scraping yearly game log web pages
I’ve written a helper function, get_player_metadata that we can use to scrape a player’s main Basketball-Reference.com page. get_player_metadata returns a dictionary of the years available for the player (in the form of a list) and the player’s name
In [3]:
player_metadata = get_player_metadata(westbrook_basketball_reference_url)
years_available_list = player_metadata.get("years_available")
total_years_of_data = len(years_available_list)
In [4]:
player_metadata{'years_available': ['2009',
'2010',
'2011',
'2012',
'2013',
'2014',
'2015',
'2016',
'2017',
'2018',
'2019',
'2020',
'2021',
'2022'],
'player_name': 'Russell Westbrook'}In [5]:
westbrook_career_game_logs_df_list = []
errors_list = []years_available_list and iterate through each year of game log data and extract player statistical information on the individual game basis with the function extract_player_game_logs. We can also get team results from the same function
In [6]:
# The url template that we pass in year info
url_template = 'https://www.basketball-reference.com/players/w/westbru01/gamelog/{year}'

# for each year of data avaialable, gather game log data
for year in years_available_list:
    # Use try/except block to catch and inspect any urls that cause an error
    try:
        print(f'getting game log data from {year}')
        # get the formatted game log data url
        formatted_url = url_template.format(year=year)
        westbrook_yearly_game_logs = extract_player_game_logs(formatted_url)

        # append the current dataframe to the list of dataframes
        westbrook_career_game_logs_df_list.append(westbrook_yearly_game_logs)

    except Exception as e:
        # Store the url and the error it causes in a list
        error =[formatted_url, e]
        # then append it to the list of errors
        errors_list.append(error)
getting game log data from 2009
getting game log data from 2010
getting game log data from 2011
getting game log data from 2012
getting game log data from 2013
getting game log data from 2014
getting game log data from 2015
getting game log data from 2016
getting game log data from 2017
getting game log data from 2018
getting game log data from 2019
getting game log data from 2020
getting game log data from 2021
getting game log data from 2022In [7]:
errors_list[]westbrook_career_game_logs_df_list into a single data frame with the concat function from the pandas module.In [8]:
print(len(westbrook_career_game_logs_df_list)==len(years_available_list))
print(len(westbrook_career_game_logs_df_list))
True
14In [9]:
westbrook_career_game_logs_df = pd.concat(westbrook_career_game_logs_df_list, axis=0)In [10]:
total_career_games = westbrook_career_game_logs_df.shape[0]
print(f"collected data for {total_career_games} games for {player_metadata.get('player_name')}")
collected data for 1093 games for Russell WestbrookIn [11]:
westbrook_career_game_logs_df.head()| player_name | basketball_ref_id | age | season | date | box_score_link | team | opponent | location | result | ... | three_pt_attempted | three_pt_pct | steals | blocks | turnovers | plus_minus | game_score | margin | result_b | active | |
|---|---|---|---|---|---|---|---|---|---|---|---|---|---|---|---|---|---|---|---|---|---|
| 0 | Russell Westbrook | w/westbru01 | 19-352 | 2008-09 | 2008-10-29 | /boxscores/200810290OKC.html | OKC | MIL | 1 | L (-11) | ... | 2.0 | 0.5 | 0.0 | 1.0 | 2.0 | 5.0 | 11.0 | -11.0 | 0.0 | 1 |
| 1 | Russell Westbrook | w/westbru01 | 19-355 | 2008-09 | 2008-11-01 | /boxscores/200811010HOU.html | OKC | HOU | 0 | L (-12) | ... | 1.0 | 0.0 | 1.0 | 0.0 | 2.0 | -19.0 | 2.8 | -12.0 | 0.0 | 1 |
| 2 | Russell Westbrook | w/westbru01 | 19-356 | 2008-09 | 2008-11-02 | /boxscores/200811020OKC.html | OKC | MIN | 1 | W (+3) | ... | 1.0 | 0.0 | 2.0 | 0.0 | 3.0 | 7.0 | 7.6 | 3.0 | 1.0 | 1 |
| 3 | Russell Westbrook | w/westbru01 | 19-359 | 2008-09 | 2008-11-05 | /boxscores/200811050OKC.html | OKC | BOS | 1 | L (-13) | ... | 5.0 | 0.6 | 1.0 | 0.0 | 2.0 | -3.0 | 6.7 | -13.0 | 0.0 | 1 |
| 4 | Russell Westbrook | w/westbru01 | 19-361 | 2008-09 | 2008-11-07 | /boxscores/200811070UTA.html | OKC | UTA | 0 | L (-7) | ... | 0.0 | 0.0 | 0.0 | 0.0 | 2.0 | -5.0 | -0.2 | -7.0 | 0.0 | 1 |
5 rows × 37 columns
In [12]:
westbrook_career_game_logs_df.info()<class 'pandas.core.frame.DataFrame'>
Int64Index: 1093 entries, 0 to 62
Data columns (total 37 columns):
# Column Non-Null Count Dtype
--- ------ -------------- -----
0 player_name 1093 non-null object
1 basketball_ref_id 1093 non-null object
2 age 1093 non-null object
3 season 1093 non-null object
4 date 1093 non-null datetime64[ns]
5 box_score_link 1093 non-null object
6 team 1093 non-null object
7 opponent 1093 non-null object
8 location 1093 non-null int64
9 result 1093 non-null object
10 game_number 1093 non-null int64
11 game 1093 non-null float64
12 started_game 1093 non-null float64
13 minutes_played 1093 non-null object
14 points 1093 non-null float64
15 field_goals_made 1093 non-null float64
16 field_goals_att 1093 non-null float64
17 field_goal_pct 1093 non-null float64
18 free_throws_made 1093 non-null float64
19 free_throw_att 1093 non-null float64
20 free_throw_pct 1093 non-null float64
21 personal_fouls 1093 non-null float64
22 assists 1093 non-null float64
23 total_rebs 1093 non-null float64
24 offensive_rebs 1093 non-null float64
25 defensive_rebs 1093 non-null float64
26 three_pt_made 1093 non-null float64
27 three_pt_attempted 1093 non-null float64
28 three_pt_pct 1093 non-null float64
29 steals 1093 non-null float64
30 blocks 1093 non-null float64
31 turnovers 1093 non-null float64
32 plus_minus 1093 non-null float64
33 game_score 1093 non-null float64
34 margin 1093 non-null float64
35 result_b 1093 non-null float64
36 active 1093 non-null int64
dtypes: datetime64[ns](1), float64(24), int64(3), object(9)
memory usage: 324.5+ KBIn [13]:
westbrook_career_game_logs_df.iloc[0]player_name Russell Westbrook
basketball_ref_id w/westbru01
age 19-352
season 2008-09
date 2008-10-29 00:00:00
box_score_link /boxscores/200810290OKC.html
team OKC
opponent MIL
location 1
result L (-11)
game_number 1
game 1.0
started_game 0.0
minutes_played 21:56
points 13.0
field_goals_made 4.0
field_goals_att 9.0
field_goal_pct 0.444
free_throws_made 4.0
free_throw_att 6.0
free_throw_pct 0.667
personal_fouls 2.0
assists 4.0
total_rebs 4.0
offensive_rebs 4.0
defensive_rebs 0.0
three_pt_made 1.0
three_pt_attempted 2.0
three_pt_pct 0.5
steals 0.0
blocks 1.0
turnovers 2.0
plus_minus 5.0
game_score 11.0
margin -11.0
result_b 0.0
active 1
Name: 0, dtype: objecttriple_double, is a binary indicator with a value of 1 when a triple double is achieved through one of 7 scenarios:
In [14]:
def triple_double(row):
    if row['points']>=10 and row['total_rebs']>=10 and row['assists']>=10:
        return 1
    if row['points']>=10 and row['total_rebs']>=10 and row['blocks']>=10:
        return 1
    if row['points']>=10 and row['total_rebs']>=10 and row['steals']>=10:
        return 1
    if row['points']>=10 and row['assists']>=10 and row['steals']>=10:
        return 1
    if row['points']>=10 and row['assists']>=10 and row['blocks']>=10:
        return 1
    if row['total_rebs']>=10 and row['assists']>=10 and row['blocks']>=10:
        return 1
    if row['total_rebs']>=10 and row['assists']>=10 and row['steals']>=10:
        return 1
In [15]:
westbrook_career_game_logs_df["triple_double"] = westbrook_career_game_logs_df.apply(triple_double, axis=1)
westbrook_career_game_logs_df.loc[:, "triple_double"] = westbrook_career_game_logs_df.loc[:, "triple_double"].fillna(0)
westbrook_career_game_logs_df["triple_double"].astype(int)
0 0
1 0
2 0
3 0
4 0
..
58 0
59 0
60 0
61 0
62 0
Name: triple_double, Length: 1093, dtype: int64In [16]:
np.mean(westbrook_career_game_logs_df["triple_double"])*10017.657822506861848In [17]:
westbrook_career_game_logs_df.shape[0]*np.mean(westbrook_career_game_logs_df["triple_double"])193.0In [18]:
westbrook_active_games_pct = np.mean(westbrook_career_game_logs_df["active"])*100
print(f"Russell Westbrook has been active for {westbrook_active_games_pct:.2f}% of his teams' games")
Russell Westbrook has been active for 91.95% of his teams' gamesIn [19]:
westbrook_active_games_df = westbrook_career_game_logs_df.loc[westbrook_career_game_logs_df["active"]==1]
triple_double_games_df = westbrook_active_games_df.loc[westbrook_active_games_df["triple_double"]==1]
non_triple_double_games_df = westbrook_active_games_df.loc[westbrook_active_games_df["triple_double"]!=1]
In [20]:
westbrook_active_games_pct = np.mean(westbrook_career_game_logs_df["active"])*100
westbrook_career_games = westbrook_career_game_logs_df.shape[0]
westbrook_active_games = westbrook_active_games_df.shape[0]
triple_double_games = triple_double_games_df.shape[0]
non_triple_double_games = non_triple_double_games_df.shape[0]
active_triple_double_pct = np.mean(westbrook_active_games_df["triple_double"])*100
In [21]:
print(f"Russell Westbrook has been active for {westbrook_active_games_pct:.2f}% of his teams' games")
print(f"He has played in {westbrook_active_games} of {westbrook_career_games} potential games")
print(f"Westbrook has recorded a triple double in {triple_double_games} games, {active_triple_double_pct:.2f}% of his active games")
print(f"Westbrook has {non_triple_double_games} games without a triple double")
Russell Westbrook has been active for 91.95% of his teams' games
He has played in 1005 of 1093 potential games
Westbrook has recorded a triple double in 193 games, 19.20% of his active games
Westbrook has 812 games without a triple doubleTo complete our comparison, we need Westbrook’s win percentage in 4 scenarios * Westbrook’s career win percentage * Westbrook’s active win percentage * Westbrook’s triple double games win percentage * Westbrook’s non-triple double games win percentage
We can use the result_b column, a binary indicator of results where 0 indicates a loss and 1 indicates a win to calculate these win percentages across our different data frames. The mean for result_b is the percentage (after multiplying by 100) of games won under the scenario
In [22]:
westbrook_career_win_pct = np.mean(westbrook_career_game_logs_df['result_b'])*100
print(f"Russell Westbrook's teams have won {westbrook_career_win_pct:.2f}% of their games")
Russell Westbrook's teams have won 54.44% of their gamesIn [23]:
westbrook_active_win_pct = np.mean(westbrook_active_games_df['result_b'])*100
print(f"Russell Westbrook's teams win {westbrook_active_win_pct:.2f}% of their games when he is active")
Russell Westbrook's teams win 59.20% of their games when he is activeIn [24]:
triple_double_win_pct = np.mean(triple_double_games_df['result_b'])*100
print(f"Russell Westbrook's teams win {triple_double_win_pct:.2f}% of their games when he DOES record a triple double")
Russell Westbrook's teams win 73.58% of their games when he DOES record a triple doubleIn [25]:
non_triple_double_win_pct = np.mean(non_triple_double_games_df['result_b'])*100
print(f"Russell Westbrook's teams win {non_triple_double_win_pct:.2f}% of their games when he DOES NOT record a triple double")
Russell Westbrook's teams win 55.79% of their games when he DOES NOT record a triple doubleIn [26]:
import tabulate
data = [["Career Win Pct", f"{westbrook_career_win_pct:.2f}%"],
         ["Active Win Pct", f"{westbrook_active_win_pct:.2f}%"],
         ["Triple Double Win Pct", f"{triple_double_win_pct:.2f}%"],
         ["Non-Triple Double Win Pct", f"{non_triple_double_win_pct:.2f}%"]]
table = tabulate.tabulate(data, tablefmt='html')
table| Career Win Pct | 54.44% |
| Active Win Pct | 59.20% |
| Triple Double Win Pct | 73.58% |
| Non-Triple Double Win Pct | 55.79% |
In [27]:
contingency_table = pd.crosstab(westbrook_active_games_df.result_b,westbrook_active_games_df.triple_double) #Contingency Table
contingency_table| triple_double | 0.0 | 1.0 |
|---|---|---|
| result_b | ||
| 0.0 | 359 | 51 |
| 1.0 | 453 | 142 |
In [28]:
z_stat, p_value = create_proportions_ztest(contingency_table)z_stat: -4.520, p_value: 0.000
Reject the null hypothesis - suggest the alternative hypothesis is trueIn [29]:
westbrook_active_games_df = copy.deepcopy(westbrook_active_games_df)
westbrook_active_games_df["year"] = westbrook_active_games_df["season"].apply(lambda x: x[0:4])
westbrook_active_games_df["year"] =  pd.DatetimeIndex(westbrook_active_games_df["year"])
In [30]:
yearly_triple_double_counts = westbrook_active_games_df.resample(rule='Y', on='year')['triple_double'].sum()
yearly_triple_double_counts
year
2008-12-31 1.0
2009-12-31 1.0
2010-12-31 3.0
2011-12-31 0.0
2012-12-31 1.0
2013-12-31 2.0
2014-12-31 11.0
2015-12-31 18.0
2016-12-31 42.0
2017-12-31 25.0
2018-12-31 34.0
2019-12-31 8.0
2020-12-31 38.0
2021-12-31 9.0
Freq: A-DEC, Name: triple_double, dtype: float64In [31]:
sns.set_style("white")
sns.set_color_codes()
# Create figure and plot space
fig, ax = plt.subplots(figsize=(12, 12))

# Add x-axis and y-axis
ax.bar(yearly_triple_double_counts.index.year,
       yearly_triple_double_counts.values,
       color='Blue')

# Set title and labels for axes
ax.set(xlabel="Season",
       ylabel="Games with a Triple Double",
       title= "Seasonal Counts of Triple Doubles by Russell Westbrook")

# add '2008' to years_available_list so that we have the Seasons shown on x-axis
years_available_list = ['2008'] + years_available_list
ax.xaxis.set_ticks([int(year) for year in years_available_list])
# Call add values function
add_value_labels(ax)
plt.show()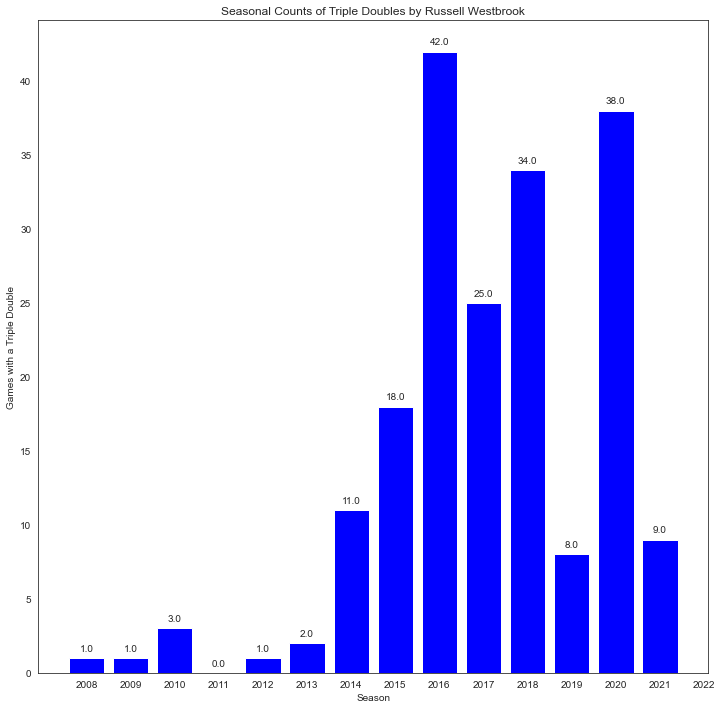
year variable from the date variableIn [32]:
# westbrook_active_games_df = copy.deepcopy(westbrook_active_games_df)
# westbrook_active_games_df["year"] =  pd.DatetimeIndex(westbrook_active_games_df["date"]).year
In [33]:
triple_double_games_df = copy.deepcopy(triple_double_games_df)
triple_double_games_df["year"] = triple_double_games_df["season"].apply(lambda x: x[0:4])
triple_double_games_df["year"] =  pd.DatetimeIndex(triple_double_games_df["year"]).year
In [34]:
triple_double_games_gb_df = triple_double_games_df.groupby(['triple_double', 'location', 'year']).size().unstack(level=2).fillna(0).T
triple_double_games_gb_df| triple_double | 1.0 | |
|---|---|---|
| location | 0 | 1 |
| year | ||
| 2008 | 0.0 | 1.0 |
| 2009 | 1.0 | 0.0 |
| 2010 | 0.0 | 3.0 |
| 2012 | 1.0 | 0.0 |
| 2013 | 1.0 | 1.0 |
| 2014 | 2.0 | 9.0 |
| 2015 | 7.0 | 11.0 |
| 2016 | 17.0 | 25.0 |
| 2017 | 16.0 | 9.0 |
| 2018 | 15.0 | 19.0 |
| 2019 | 3.0 | 5.0 |
| 2020 | 17.0 | 21.0 |
| 2021 | 4.0 | 5.0 |
In [35]:
# triple_double_games_gb_df.plot(kind = 'bar')In [36]:
sns.set_style("white")
sns.set_color_codes()
fig, ax = plt.subplots(figsize=(16, 6))
fig.subplots_adjust(hspace=0.4)
plot_title = 'Seasonal Counts of Triple Doubles by Russell Westbrook \n Home vs Away'
triple_double_games_gb_df.iloc[:,].plot(ax = ax, title = plot_title,
                                        ylabel = "Games with a Triple Double",
                                        xlabel= "Season")
plt.axvline(x=2015.5, color='k', linestyle='--')
plt.xticks([int(year) for year in years_available_list])
plt.legend(["Away", "Home", "Kevin Durant Leaves OKC"], loc ="lower right")
plt.show()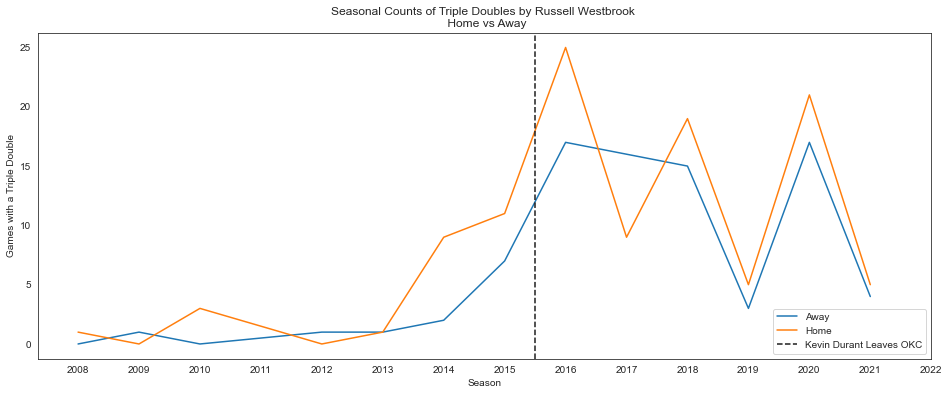
Let’s look at two scenarios that add to the Russ/triple double debate. 1. Russ’ play post-partnership with Kevin Durant 2. The margin of wins/losses when Russ records a triple double
Since teammate Kevin Durant left in Free Agency before the 2016 season, Westbrook won his only MVP and started to define his play with triple doubles * How many triple doubles has Russ created when he was teammates with Kevin Durant in comparison to the years after they were no longer teammates? + Note: Westbrook is an older player and more established in seasons post playing with Durant and it will not be surprising if he records more triple doubles as a tenured player than as a younger player
In [37]:
triple_double_games_gb_df2 = triple_double_games_gb_df[1].reset_index(level="year")
triple_double_games_gb_df2.keys().name = ''
triple_double_games_gb_df2.rename(columns={0:"Away", 1:"Home"}, inplace=True)
triple_double_games_gb_df2| year | Away | Home | |
|---|---|---|---|
| 0 | 2008 | 0.0 | 1.0 |
| 1 | 2009 | 1.0 | 0.0 |
| 2 | 2010 | 0.0 | 3.0 |
| 3 | 2012 | 1.0 | 0.0 |
| 4 | 2013 | 1.0 | 1.0 |
| 5 | 2014 | 2.0 | 9.0 |
| 6 | 2015 | 7.0 | 11.0 |
| 7 | 2016 | 17.0 | 25.0 |
| 8 | 2017 | 16.0 | 9.0 |
| 9 | 2018 | 15.0 | 19.0 |
| 10 | 2019 | 3.0 | 5.0 |
| 11 | 2020 | 17.0 | 21.0 |
| 12 | 2021 | 4.0 | 5.0 |
In [38]:
with_kd_mask = triple_double_games_gb_df2["year"]<2016
without_kd_mask = triple_double_games_gb_df2["year"]>=2016
In [39]:
triple_double_games_gb_df2.loc[without_kd_mask]| year | Away | Home | |
|---|---|---|---|
| 7 | 2016 | 17.0 | 25.0 |
| 8 | 2017 | 16.0 | 9.0 |
| 9 | 2018 | 15.0 | 19.0 |
| 10 | 2019 | 3.0 | 5.0 |
| 11 | 2020 | 17.0 | 21.0 |
| 12 | 2021 | 4.0 | 5.0 |
In [40]:
# triple_double_games_gb_df2.loc[with_kd_mask]In [41]:
triple_doubles_without_kd = sum(triple_double_games_gb_df2.loc[without_kd_mask]["Away"])+ sum(triple_double_games_gb_df2.loc[without_kd_mask]["Home"])
triple_doubles_with_kd = sum(triple_double_games_gb_df2.loc[with_kd_mask]["Away"])+ sum(triple_double_games_gb_df2.loc[with_kd_mask]["Home"])
In [42]:
print(f"Westbrook recorded {triple_doubles_with_kd} triple doubles in {triple_double_games_gb_df2.loc[with_kd_mask].shape[0]} seasons with Kevin Durant as a teammate")
print(f"Westbrook has created {triple_doubles_without_kd} triple doubles in {triple_double_games_gb_df2.loc[without_kd_mask].shape[0]}+ seasons without Kevin Durant as a teammate")
Westbrook recorded 37.0 triple doubles in 7 seasons with Kevin Durant as a teammate
Westbrook has created 156.0 triple doubles in 6+ seasons without Kevin Durant as a teammateLastly, the game margin during triple double games can provide a naive comparison about how Russ’ pursuit of a triple double affects his team. For instance, if Russ is selfishly pursuing triple doubles at the expense of team success, we could expect that the margin of loss is greater in loses where he records a triple double than in loses where a triple double is not achieved. Similarly, smaller win margins in games with a triple double than without a triple double could suggest a negative team effect when Russ creates a triple double. * what is the margin difference in games that are won/lost, but a triple double is recorded? * compare to margin for games won/lost without a triple double
In [43]:
triple_double_win_margin = np.mean(triple_double_games_df.loc[triple_double_games_df["result_b"]==1]["margin"])
triple_double_loss_margin = np.mean(triple_double_games_df.loc[triple_double_games_df["result_b"]==0]["margin"])
non_triple_double_win_margin = np.mean(non_triple_double_games_df.loc[non_triple_double_games_df["result_b"]==1]["margin"])
non_triple_double_loss_margin = np.mean(non_triple_double_games_df.loc[non_triple_double_games_df["result_b"]==0]["margin"])
In [44]:
margin_data = [["Triple Double Win Margin", f"{triple_double_win_margin:.2f}"],
               ["Non-Triple Double Win Margin", f"{non_triple_double_win_margin:.2f}"],
               ["Triple Double Loss Margin", f"{triple_double_loss_margin:.2f}"],
               ["Non-Triple Double Loss Margin", f"{non_triple_double_loss_margin:.2f}"]]
margin_table = tabulate.tabulate(margin_data, tablefmt='html')
margin_table| Triple Double Win Margin | 11.55 |
| Non-Triple Double Win Margin | 11.59 |
| Triple Double Loss Margin | -7.27 |
| Non-Triple Double Loss Margin | -9.96 |
In all honesty, these results are surprising (to me) and speak well for Russ and his supporters
1steals and blocks were added to the box score almost a decade after points, rebounds, and assists. This blazersedge.com article has excellent documentation of the NBA box score’s evolution
In [45]:
import sys
import IPython
import matplotlib as mpl
from datetime import datetime
print('originally published 2022-03-06 11:43')
print(f'last updated: {datetime.now().strftime("%Y-%m-%d %H:%M")} \n')
print(f'Python version: {sys.version_info}')
print(f'matplotlib version: {mpl.__version__}')
print(f'iPython version: {IPython.__version__}')
print(f'urllib version: {urllib.request.__version__}')
print(f'seaborn version: {sns.__version__}')
print(f'pandas version: {pd.__version__}')
originally published 2022-03-06 11:43
last updated: 2022-03-06 19:22
Python version: sys.version_info(major=3, minor=9, micro=7, releaselevel='final', serial=0)
matplotlib version: 3.4.3
iPython version: 7.29.0
urllib version: 3.9
seaborn version: 0.11.2
pandas version: 1.4.1